

Quarterly Review and Outlook:
September 2026
"Rocky Mountain High"

LJohnson@fcbanking.com
412-208-7687
Connect on LinkedIn
A Look Back
The above title is from a song written and performed by folk singer John Denver. It was released in 1972 and climbed to #9 on the Billboard charts. It is also one of the two official state songs of the state of Colorado. Denver had another pretty popular song, Take Me Home, Country Roads, which was released a year earlier. That also is an official state anthem for West Virginia and can be heard at almost every WVU sporting event. Listening to Rocky Mountain High recently made me think of the recent new high seen in the S&P 500, as well as the recent move by the Fed to raise short-term interest rates by a quarter point on September 16th…from a target range of 3.50-3.75% to 3.75-4.0%. Interest rates and their absolute levels are and have always been a two-sided coin for businesses and individuals alike. Higher rates are great if you are a conservative saver in money markets or CDs…but not so good if you are a borrower. Higher rates mean higher debt payments and less disposable income. Lower rates are just the opposite…great for borrowers and tough on savers. So, it has been the Fed’s ongoing goal to balance competing forces and try to get to a neutral rate that affords a level of saving that is meaningful and yet for people and companies to borrow without breaking their backs. Theoretically, the short-term neutral rate is one that “neither stimulates nor restrains the economy…consistent with full employment and stable inflation.” Therein lies the rub. Those two main Fed undertakings are always moving, and sometimes quickly.
Currently, we have and have had stability on the Jobs front. The most recent Employment Report showed the U.S. economy added 29,000 jobs in September versus an expected gain of 90,000. Additionally, unemployment ticked up to 4.2% from 4.1%...which is still historically low. When I started my career in the mid-1980s, a 5% unemployment rate was considered “full” employment. The U.S. Bureau of Labor Statistics also revised July and August jobs gains downward. Many economists have labeled the current environment as “low-hire, low fire” with a structural shift because of an aging population, increased Baby Boomer retirements, a decline in immigration and advancement in artificial intelligence. Those all ring true and we are starting to see many younger adults re-think the college experience versus trade schools and the benefits and job security they can bring. In our view, that is not such a bad thing as the work force is an ever-evolving thing…one that is necessarily responding to technological changes and efficiencies.
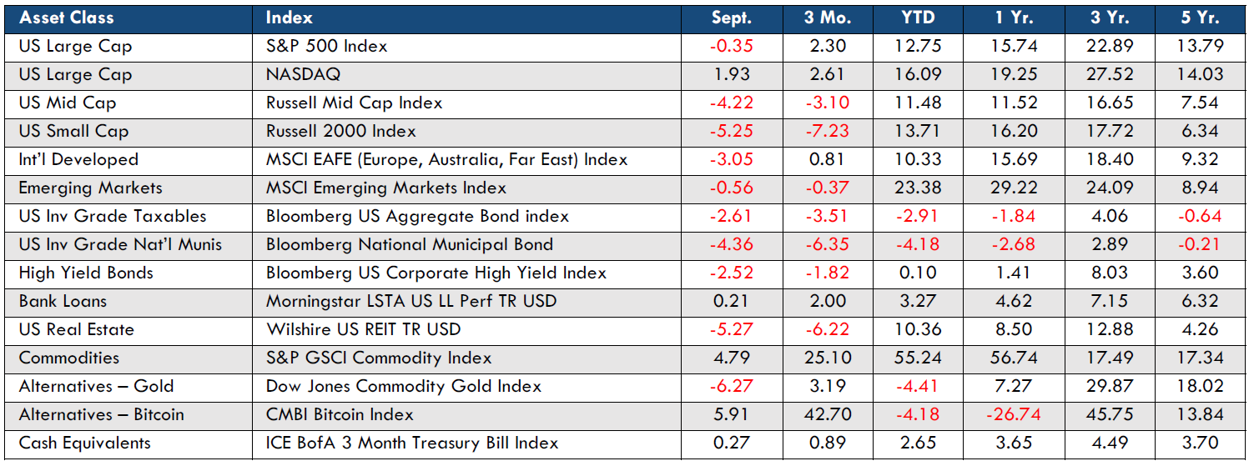
The financial markets were mixed in September. The big-cap S&P 500 was down a smidge, while the tech-heavy NASDAQ was up 1.93%. Small-cap domestic stocks continued their recent slide after overperforming in the first half of 2026, down 5.25% in the month. International stocks were also negative for the month but still show solid YTD performance. Importantly for most investors, core bonds experienced a significant road bump, delivering a -2.61% return, and are now down nearly 3% for the year. Yikes! The two-year U.S. treasury yield increased over .5% in September, from 4.35% to 4.88%...that is a big move in the treasury market in general, and especially in one month. In my experience, most investors have a more difficult time understanding bond markets. When you have a rapidly increasing yield curve as we have…bond prices are moving in the opposite direction =>(lower), which leads to negative returns.
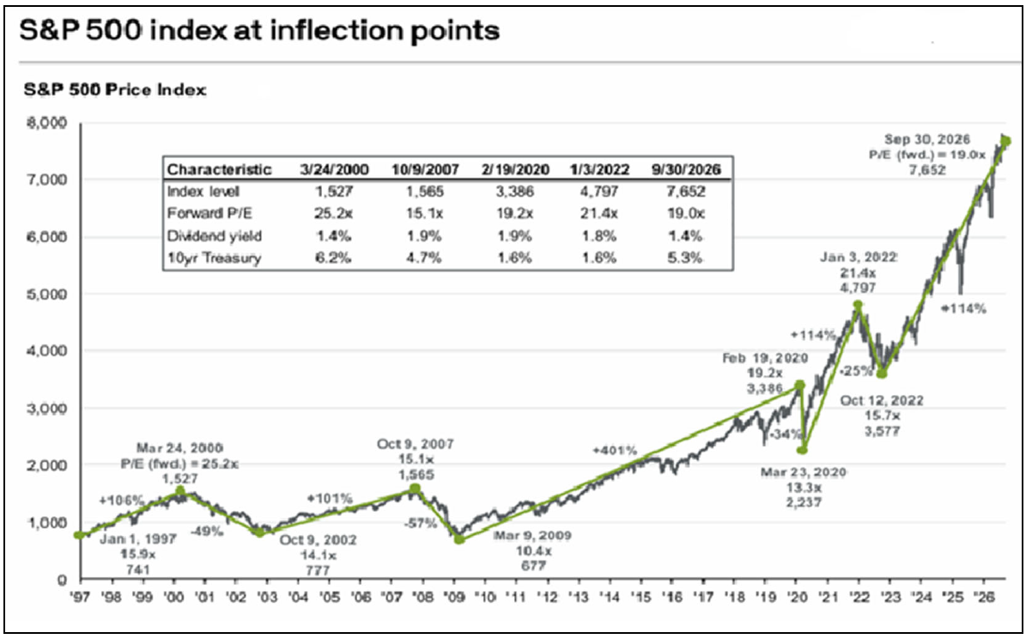
The chart below shows the S&P 500 index at various inflection points over the last 30 years. You can see that Rocky Mountain High made in September. The index made another new high on October 6th. That closing high of 7818 represented the 28th new alltime the S&P 500 delivered this year. That rapid rise shown from the October 2022 low to present is nearly vertical and results in a 114% increase in around four years. Perspective is always useful and important…in the markets and in life. Often, it is important to know where you come from when you are trying to figure out where you are going!
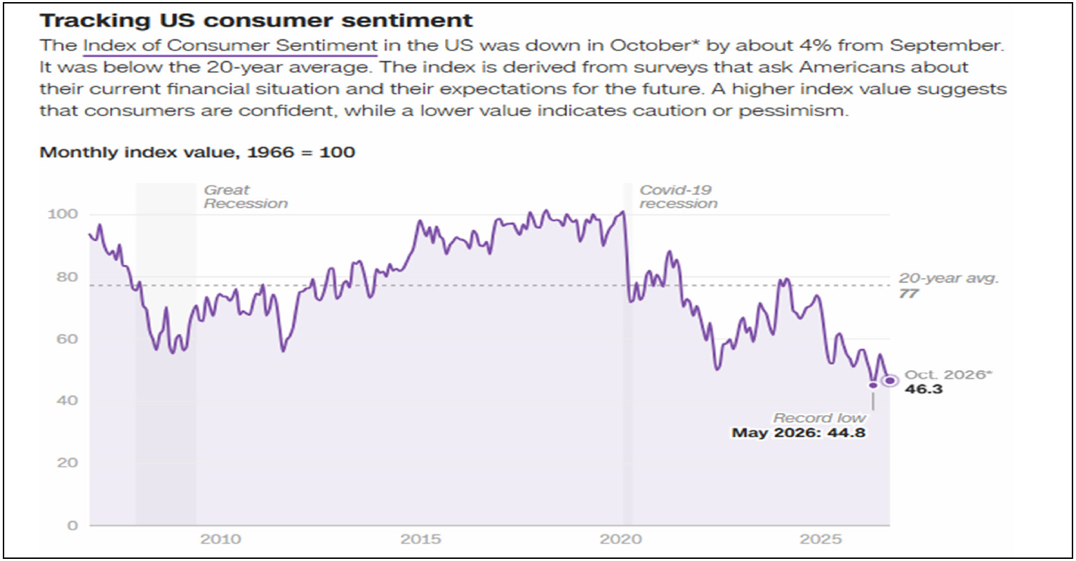
Now, let’s compare the rise of the U.S. stock market with how consumers are feeling about their current and future financial situation. The answer is: not so good. The current October reading of 46.3 is just above the record low of 44.8 in May. Again, for perspective the long-term average of this survey is around 84. Geo-political concerns, rising fuel prices and inflation in general have started to affect household spending…at least in what they are spending on.
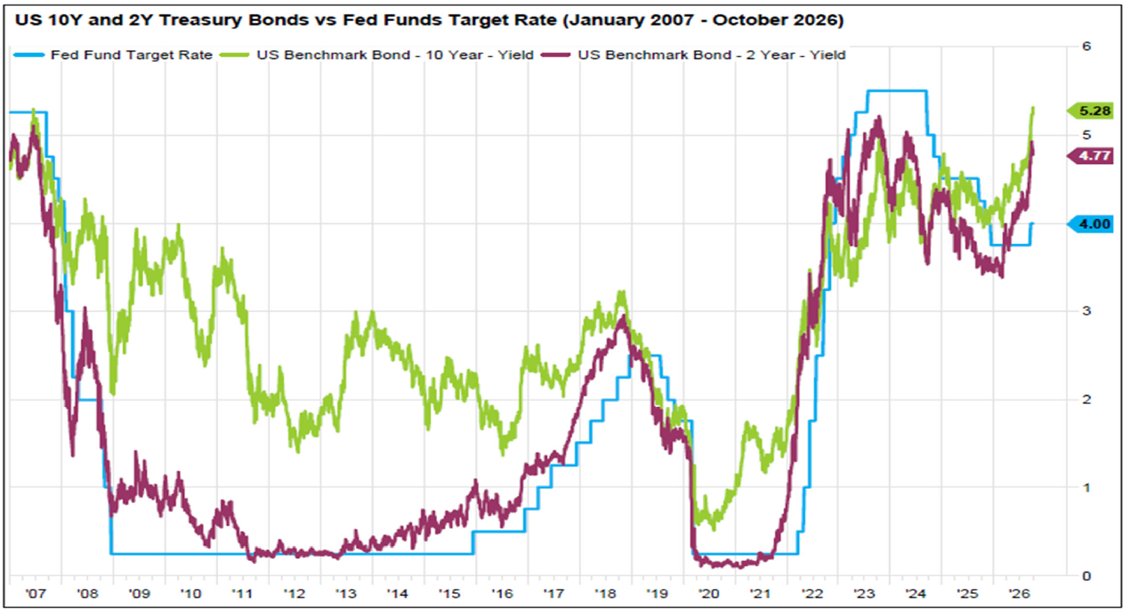
This next chart below is worthy of taking up a decent amount of space. It shows three important yield barometers, the short-term Fed Funds rate discussed, as well as the two and ten-year U.S. Treasury bond. We see two distinct periods where the Fed deemed it necessary to aggressively take rates lower: the Great Recession of 2008-09 and Covid. In both cases, rates stayed near zero for prolonged periods of time…longer than many pundits felt appropriate. We felt that aggressive moves were needed in both instances, but I will say that it can have perverse and unintended consequences. There is a behavioral finance study in here somewhere, but people really hate earning nothing on their money…and will look for other avenues and landing spots, often with much more risk, for their hard-earned money.
We believe that longer-term bonds are now at a sufficient yield that represents a more attractive return for investors. It’s not that those yields cannot continue higher…and they will if inflation remains stubborn, but if you buy a ten-year Treasury bond at 5.3% today and hold it for ten years…you’ll earn a 5.3% annualized return. There is an inherent pivot point where investors will move from the riskier stock investment to the safer bond return…maybe not en masse, but at least around the margins.
A Look Forward
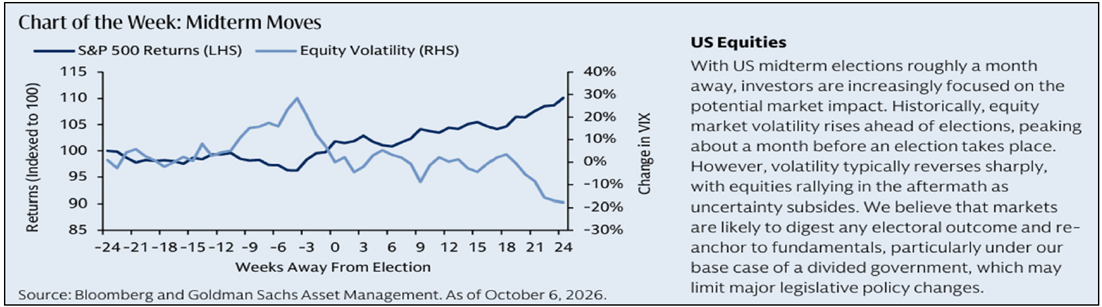
As we look forward, we are confident that there are several developments that can shape how the rest of the year and into 2027 plays out. A resolution in the Middle East should lead to lower prices at the pump and the residual inflation associated with it. We also have mid-term elections around the corner here in the states that many are intently watching. The historical numbers suggest that elections tend to have very little long-term effect on markets. The box below shows the short-term impact. Usually, there is an uptick in volatility and downtick in stock prices a month before elections. However, they both tend to reverse dramatically as
uncertainty subsides. We/markets hate uncertainty!
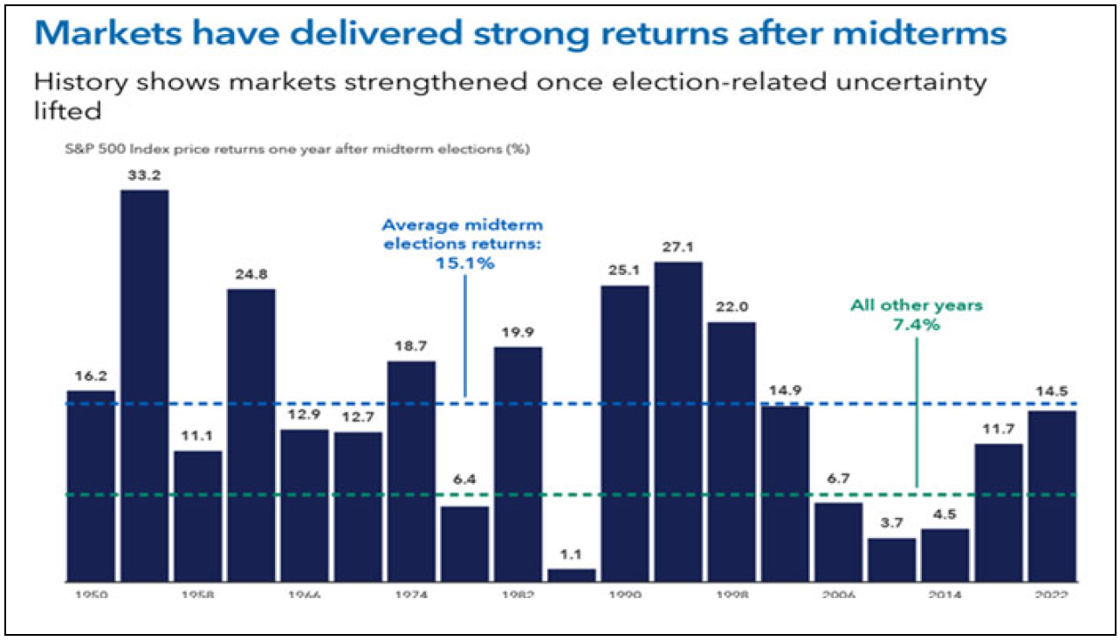
The chart below shows the strength of markets after mid-term elections over the last 75 years. In fact, the year after mid-term elections has averaged 15.1% returns versus 7.4% in all other years. Of course there are outliers, but the difference is significant and there are no negative outcomes in this data set of 19 observations!
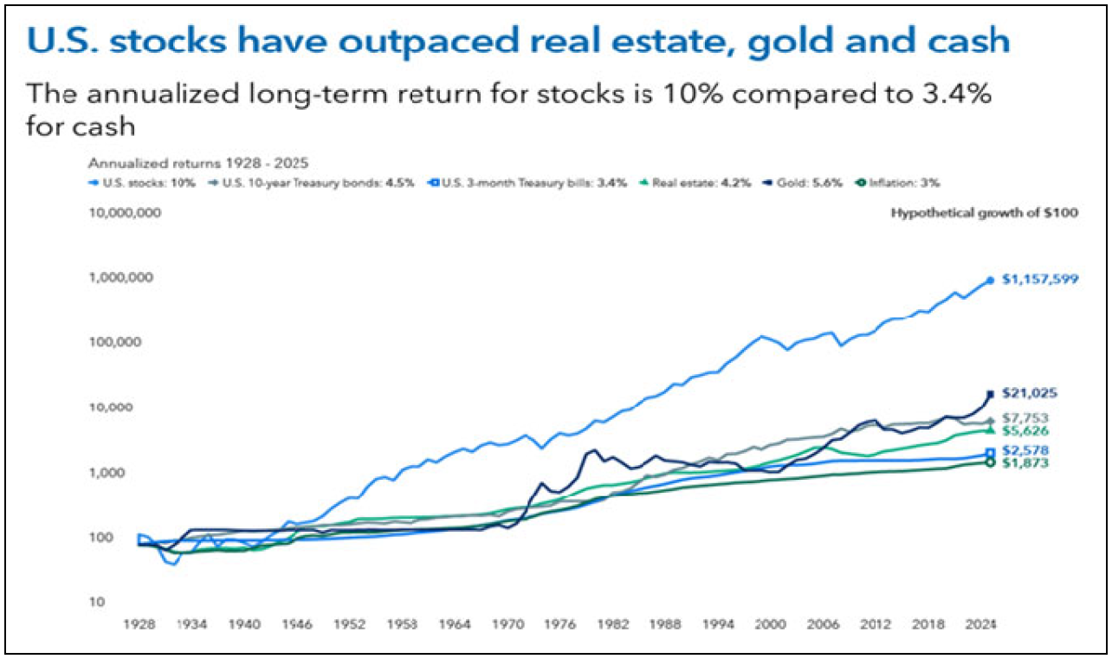
We end with a dramatic chart with an extremely long time-horizon of nearly 100 years. We talk with clients often about the resilience of our financial markets and the benefits of investing over time…and how the beauty of compounding returns over that time really makes a difference. $100 invested in stocks in 1928 with a 10% annualized return would be worth nearly $1.2 million today. Gold, the next best asset class shown, with a 5.6% annualized return, would be worth $21,000. I double-checked the numbers.
We continue to have a neutral allocation in our equity sleeve and a shorter duration in our bond allocation. That, coupled with a slight overweight to Cash has benefited performance. We will enjoy the highs with John Denver as we watch how the last part of 2026 unfolds.