

Quarterly Review and Outlook:
June 2026
"Our Country."

LJohnson@fcbanking.com
412-208-7687
Connect on LinkedIn
A Look Back
The above title is from a song written and performed by John Mellencamp. It was released on the Freedom Road album in 2007. The album debuted at #5 on the Billboard charts and was the highest of his career. The song, Our Country had prior exposure, as it was featured in commercials for Chevrolet trucks. The first several lines go like this, “Well, I can stand beside ideas I think are right…And I can stand beside the idea to stand and fight…I do believe there’s a dream for everyone…This is our country.” As we celebrated the 250-year anniversary of our great nation, I thought this was an appropriate way to honor our country. As we think about our history and its place in the history of the world, it really is quite amazing how much we have accomplished in a relatively short timeframe. We will unabashedly share some charts that illustrate the U.S.’ standing in the world economic structure, and its importance in the global financial markets.
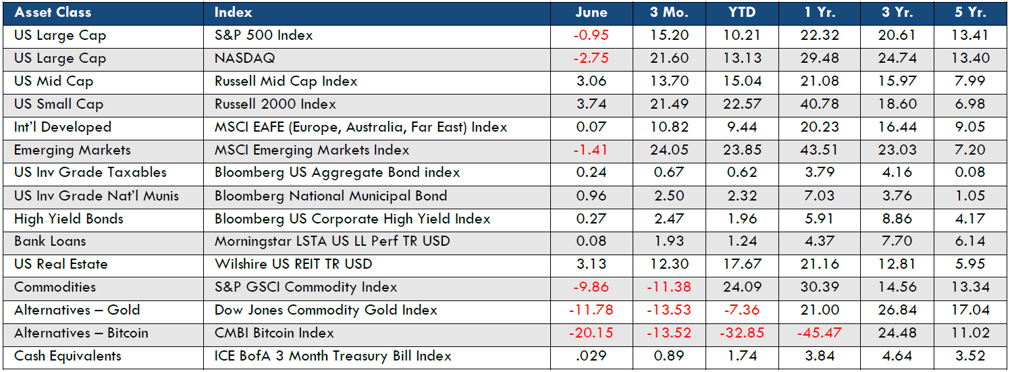
Although the month of June was just so-so for most asset classes, the 2nd quarter and YTD numbers are extremely impressive. The large-cap S&P 500 was up over 15% in the quarter and over 10% in the first half of 2026. Small-cap U.S. stocks had one of the best quarters in history, returning 21.49%. Emerging Market stocks trailed off a bit in June, but ended the quarter up over 24%. June was a particularly bad month for some alternative asset classes. Commodities turned negative by nearly 10% and Bitcoin was down more than 20% in one month. The fall in Bitcoin has been significant and steady over the last 12 months…after peaking at $115,000 a year ago, it closed June at $58,000, down 50% from its high. Core bonds eked out a small gain of .24% in the month and are now up .67% for the year.
New Fed chairman Kevin Warsh led his first FOMC meeting in mid-June and the Fed held the short-term Fed Funds rate unchanged. More importantly, he laid his plans for the Fed to be less predictive in where rates are heading, while stating that the committee will remain independent and follow the economic data to determine interest rate policy and movement. All-in-all it was a productive meeting for Warsh and most felt that he handled the spotlight well. He reiterated the desire for the Fed to get to a “neutral” Fed Funds rate of somewhere around 2% over the next months/years. The well-followed rate currently stands at 3.50-3.75%.
If we were trying to overly simplify the various economic indicators over the second quarter of 2026, we might say something like, “it’s been ok”. Inflation did pick up, with energy costs leading the way as a result of the prolonged U.S.-Iran-Israel conflict. I drive a diesel car and can say that $6-$7 a gallon is more than a little hard to swallow. Collectively, consumers are still spending. It’s been uneven as the top wage-earners have been driving discretionary spending. Those with little wiggle room from check to check have been forced to tighten the purse strings. The job situation remains solid, if not robust. In the latest report, the economy added 57,000 jobs and the unemployment rate dipped to 4.2%. Economists have that this reflects a slower-paced “low hire, low fire” market…again, not great, but okay given the geopolitical and resulting inflationary pressures. The AI-driven investment by large companies continued to drive the financial market and the hope for continued earnings and overall economic growth.
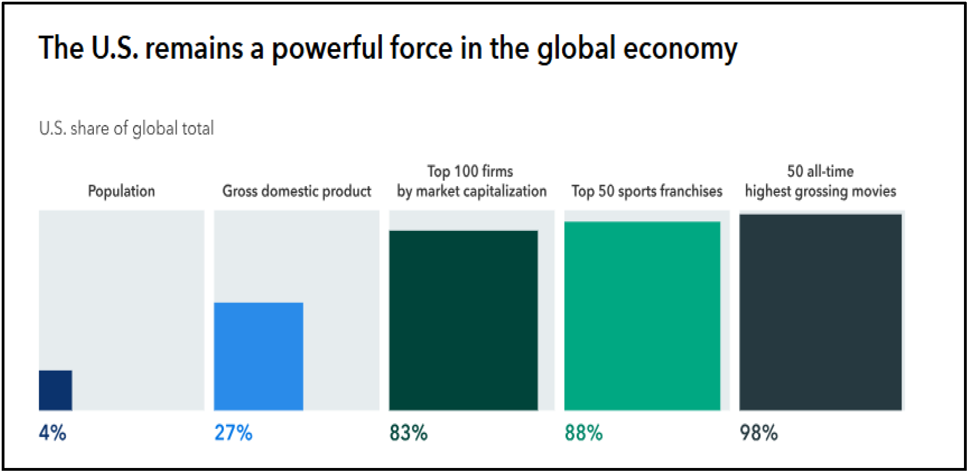
This chart is meant to be a little fun, but it does show some of the U.S. dominance we referenced earlier. With just a fraction of the global population, we represent 27% of global GDP. Perhaps most surprising is that 83% of the top firms by market cap are domiciled here in the states. (or maybe it is that we are responsible for 49 of the top 50 all-time highest grossing movies!) The one non-U.S. film is the Chinese release Ne Zha 2.
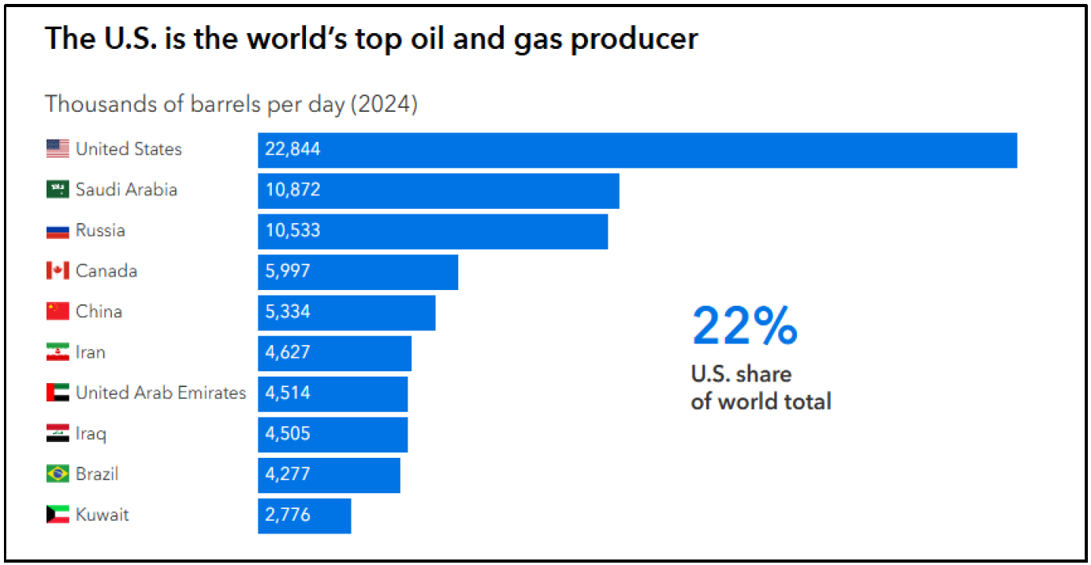
This chart might surprise some. When combining crude oil and liquid natural gas, the United States produces nearly 23 million barrels a day, or double the next two countries, Saudi Arabia and Russia. Perhaps not so surprising is that the U.S. is also the world’s biggest consumer with an average of over 20 million barrels a day, followed by a fast-closing China with 16 million barrels. It is no wonder why conflict in Middle East and the resulting slowdown of oil movement through the Strait of Hormuz has had such an effect on prices worldwide. The Strait is the busiest choke point for the global oil trade as over 20 million barrels passed through daily, accounting for roughly 25% of that global trade
I’m old enough to remember the gas-rationing lines at local stations in the late 1970s as we were much more dependent on other countries to satisfy our thirst and need for the black gold. This is certainly not to say that we are entirely self-sufficient when it comes to oil needs, but rather that we have slowly become less and less dependent and are more insulated from global disruptions than at any time in our country’s past.
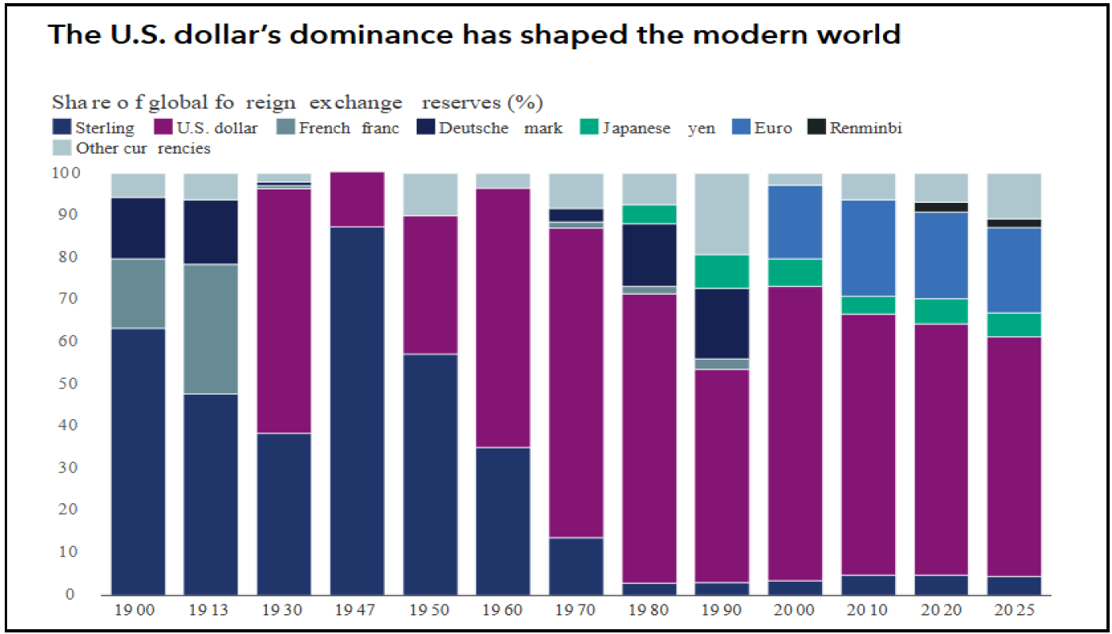
One final U.S. back-patting is represented in the chart below. The U.S. dollar has become the currency of the modern world…and this has happened in a relatively short period of time. Equally as important is that it has been consistently such over the last 100 years or so. In 2002, twelve European countries started using the Euro as their cash currency and more have adopted it since…but it is still dwarfed in size compared to the dollar for foreign exchange reserves.
A Look Forward
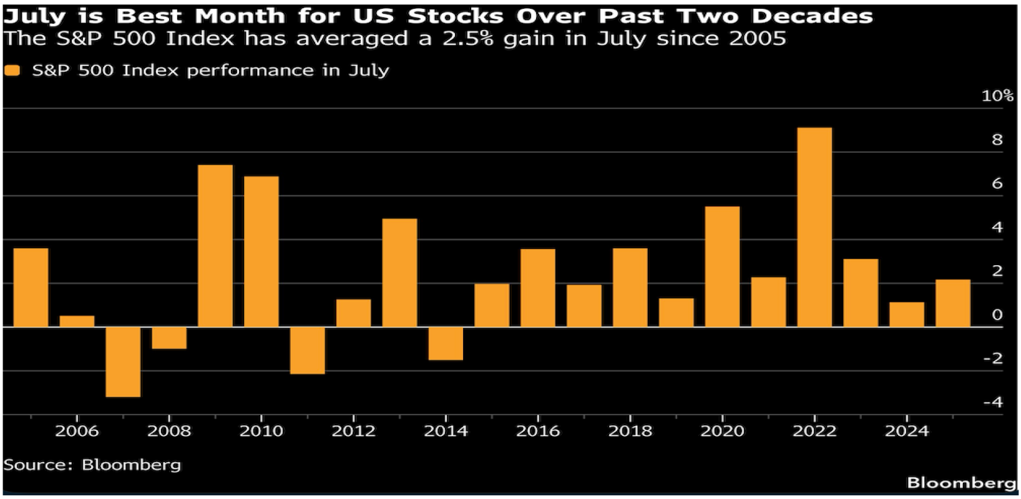
As we look forward, we are reminded that the month of July has been the best month for U.S. stocks over the last two decades. July has been positive 11 years in a row and 16 of the last 20, with an average return of 2.5%. Of course, charts like these don’t really guarantee anything, but eleven in a row of anything is worth paying attention to.
So, that’s the good news…main economic indicators look okay…The real power and dominance of the United States on a global stage is still significant and really amazing when you consider how young we really are as a country. The AI trade and momentum is a real thing. Large investments in infrastructure and people have been a great overall boost to this economy. Importantly, we see some exciting benefits already and on the horizon that will simplify our lives and increase overall productivity. The ability to deliver quicker and more accurate diagnoses in the health field could be a game changer and literally save lives.
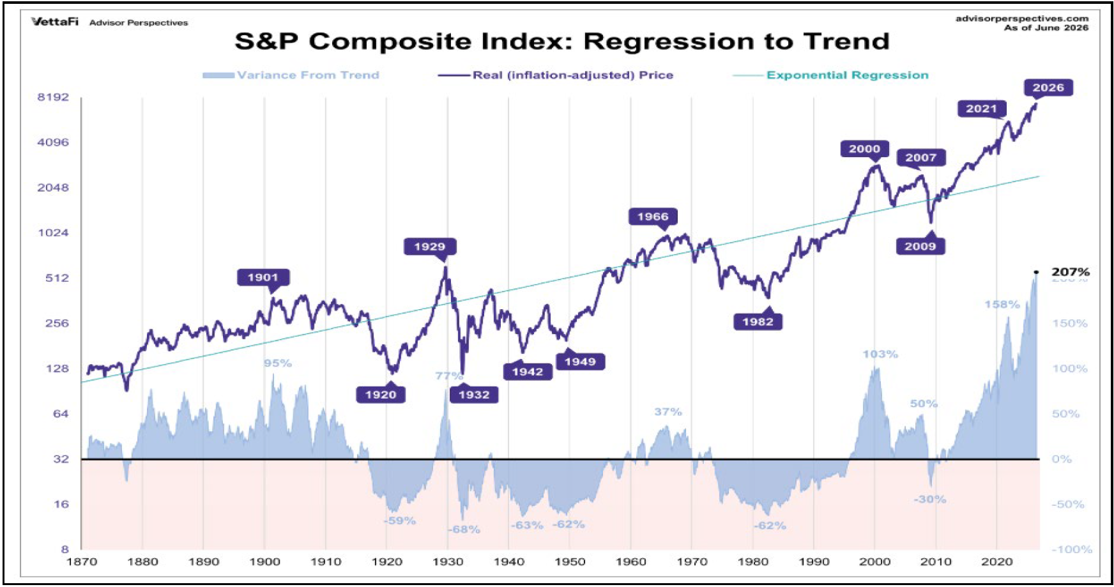
If we are doing our jobs right, we have to look at everything and be able step back with perspective…and so, we have to recognize that there are some potential headwinds to a continued march higher in the stock market. The chart below shows the rise of the S&P 500 with a trend line drawn through it. We are currently 207% above that long-term trend. This is not a short-term indicator and tells us nothing about what tomorrow looks like, but it is worth knowing and noting. It is just a reminder that we have been on quite a run since we dipped below that trend in 2008 during the Great Recession.
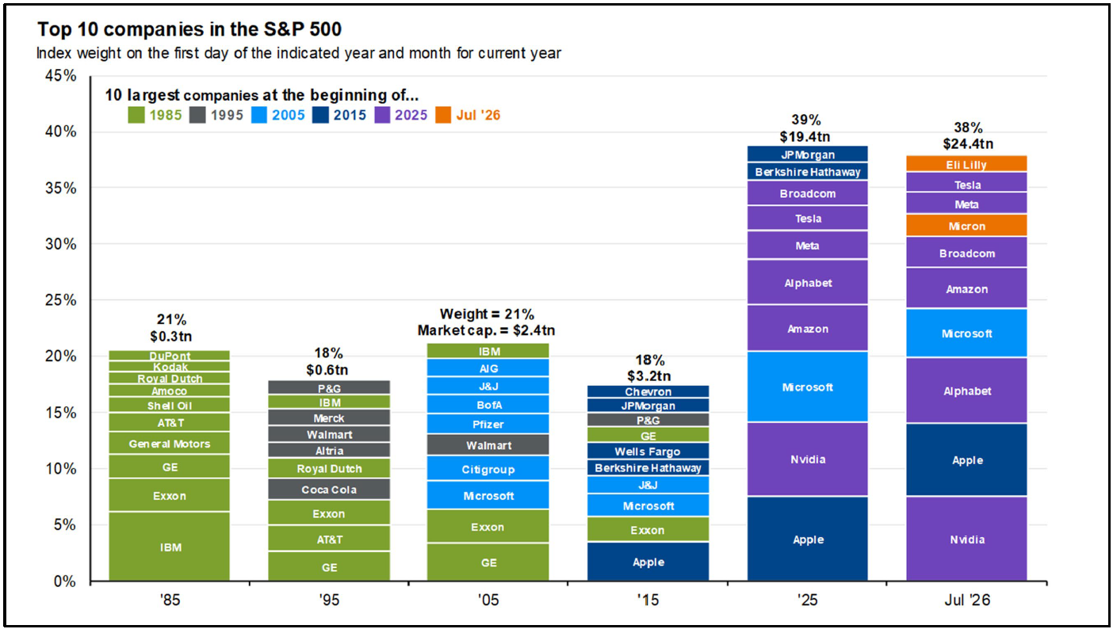
We end with an interesting chart that illustrates just how much the financial markets and the leaders of those markets have changed over time. When I first started the business in 1986, IBM and GE were the main stocks that were most watched for market direction. Now, it’s Microsoft, Apple, Nvidia, etc. In fact, Microsoft is the only company in the top 10 from just 15 years ago. It’s also been the beauty of just owning the S&P 500. Those leadership changes are realized by holders of the index.
We are neutral in our big-picture allocation between stocks and bonds, with a slight overweight to Emerging Market stocks. We believe bonds have a chance to deliver more normal returns over the next 6-12 months as rates normalize. John Melloncamp ended Our Country with, “from the east coast to the west coast…down the Dixie Highway…back home…this is our country.” With all of the challenges, we are blessed to live in this country and all that it affords us. Happy birthday USA!