
Quarterly Review and Outlook:
March 2025
"Ch Ch Changes"

LJohnson@fcbanking.com
412-208-7687
Connect on LinkedIn
A Look Back
The above song title comes from the 1971 album, Hunky Dory, by the iconic Englishman, David Bowie. The song originally flopped as a single, but ultimately became regarded as one of Bowie’s best songs. Many music critics believed that Changes represented one of his best vocal performances. Hearing it recently had me pondering all of the various changes that are happening now…economically, financial markets, politically, societal, and more. Confucius said, “Only the wisest and stupidest of men never change.” I believe what he meant was that we should not fear change, while also being able to stick with things that have proven to work and are good. As a society, we face these kinds of issues all of the time, and maybe never more so than right now. It seems most of the globe is politically divided. Technology advancements such as artificial intelligence have the promise of radically improving/disrupting our everyday lives. It is against this backdrop that financial markets are currently finding their way.
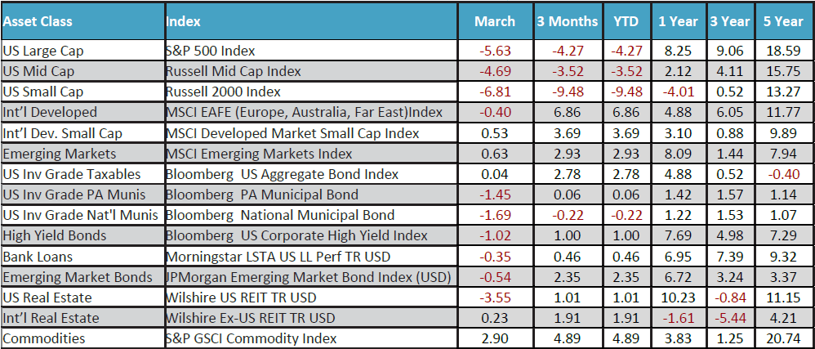
March saw stock indexes move lower here in the U.S. The large-cap S&P 500 was down 5.63% and small-cap stocks fared even worse. International stocks continued their first quarter out-performance. For the quarter, Developed International equities bettered the S&P 500 by over 11%, illustrating the importance of having a diversified portfolio allocation. In addition, core bond exposure provided a safe haven, delivering a strong 2.78% return in the quarter. For perspective, asset-class diversification really has not been such a great thing over the last couple of years. The larger U.S. companies have handily beaten those companies and countries from around the globe. It remains clear when looking at the five year annualized numbers in the table above. The S&P 500 show a 18.59% return…again, that is an annualized number and twice the long-term average. It is also double that of International stocks. To put that into dollar terms, $1,000,000 invested in the S&P 500 five years ago would be worth $2,535,000 today. The same $1,000,000 invested in Developed International stocks would be worth $1,641,000…or a nearly $900,000 difference! It is these types of stark differences that lead us to our diversified approach. Unfortunately, it is extremely difficult (impossible) to know when and for how long these differences materialize. What we know from a much longer-term time horizon is that yesterday’s winners eventually become tomorrow’s losers and vice-versa. Putting your investment eggs into one basket is, and has been fraught with un-needed risk. Not only do you need to be right initially, but you also need to be right again when you decide to go the other way. That is just too difficult. We would rather just acknowledge that change is inevitable and invest accordingly.
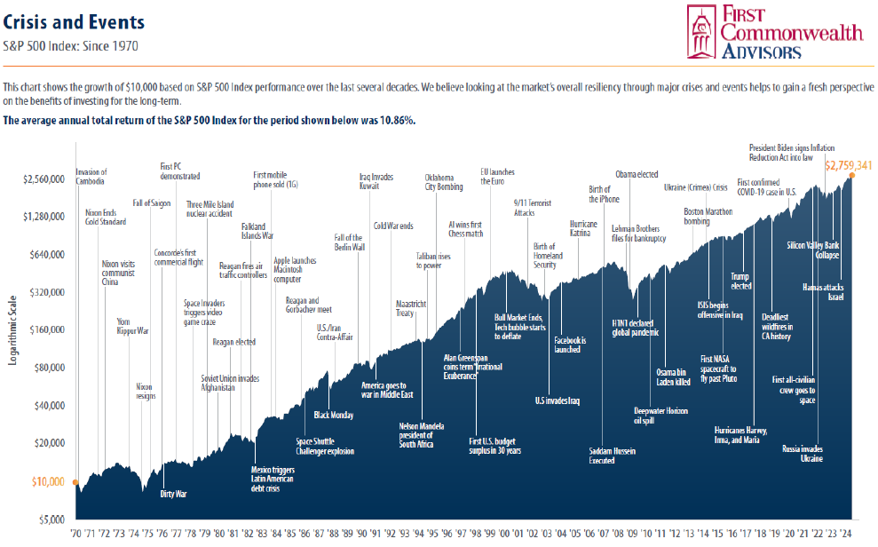
We like the above chart and use it often when talking with newer clients or reassuring existing ones. It looks at the growth of $10,000 invested in the S&P 500 since 1970. It also shows the many economic and geo-political events that have occurred over that timeframe. It spans from the end of the Vietnam War to the more recent Hamas attack on Israel, and everything between. There were many significant financial market stresses as well. I was only one year into my career when I experienced Black Monday in 1987, when the Dow Jones Industrial Average was down more than 22% in one day. Yikes! Having perspective and looking at the bigger picture is usually a good thing…and especially so when it comes to markets and investing.
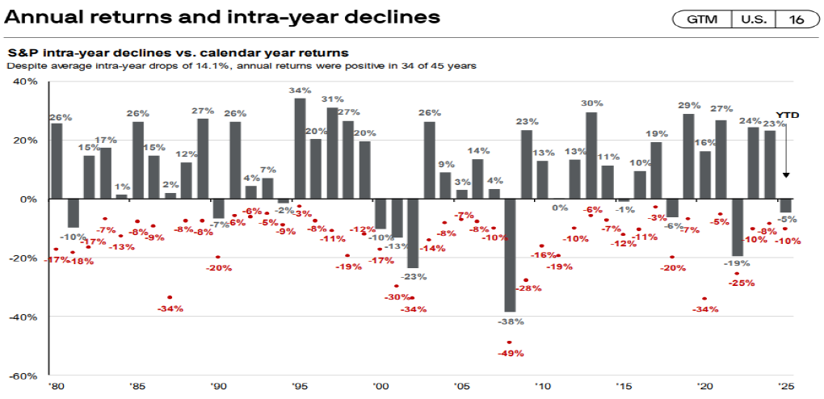
The chart above is another important reminder of how things typically play out in the stock markets. It looks at the calendar year performance of the S&P 500 since 1980, along with the largest intra-year decline from high to low. Corrections of 10% or more are not that unusual in any given year. In fact, it is more the norm. Indeed, in both 2023 and 2024, we saw declines of 10% and 8%, respectively. In both years, the bellwether index ended the year with well over 20% returns. The pandemic year of 2020 really stands out with a 34% decline and finishing the year with a +16%.
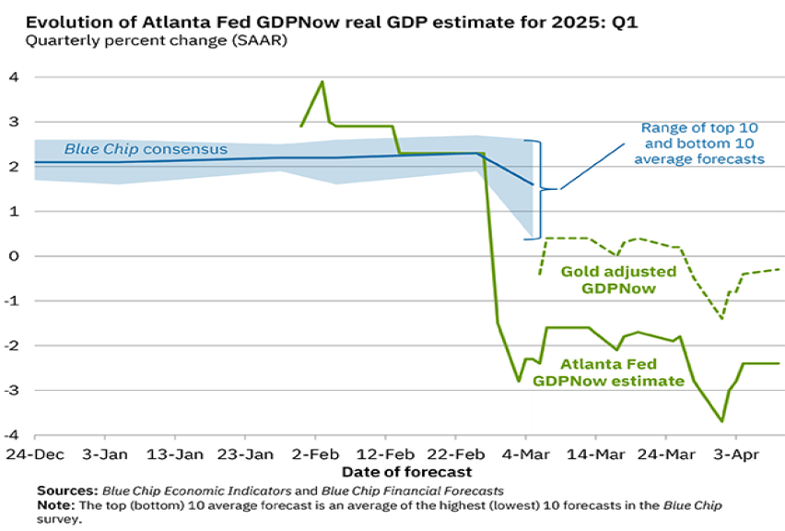
In the graph below, we take an important look at how all the recent policy changes have affected expected growth here in the states. The GDPNow website has been one of the most looked-at resources for Gross Domestic Product estimates. The blue shaded area show the range of top ten and bottom 10 estimates at any given time. The forecast is updated weekly as new data becomes available…and news happens. On February 19, the model estimated 2.3% first quarter growth in the U.S. Because of declining manufacturing numbers and lower retail sales and industrial production, the model changed to a negative 1.5% estimate just nine days later. The estimate has dropped further with recent tariff announcements, and stands at -2.4%. For context, we do not normally see that scale of change in the estimates in such a short period. Potential slower growth and recessionary pressures are now part of the potential changes.
A Look Forward
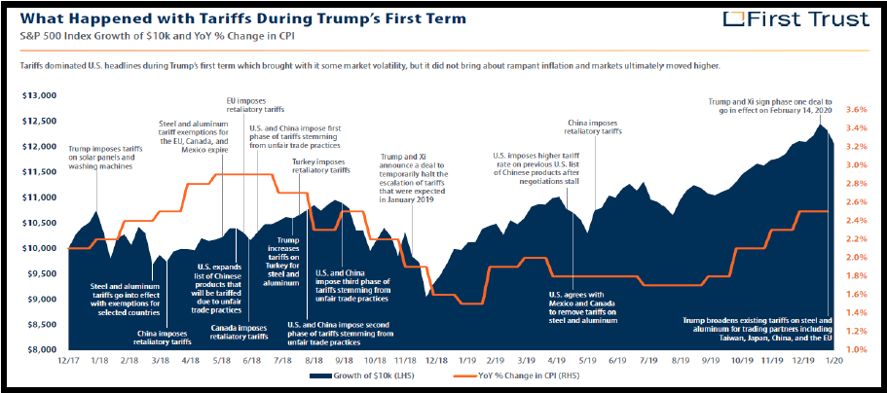
The $64,000 question…so, now what? Fortunately, we have some recent past to draw upon. There was some tariff activity in President Trump’s first term. Conventional wisdom is that tariffs, in general, tend to lead to higher prices. The graph below shows the timeline of the various first-term tariffs and the resulting move in the S&P 500 and inflation. With increased volatility, stocks ultimately moved higher and there was not runaway inflation.
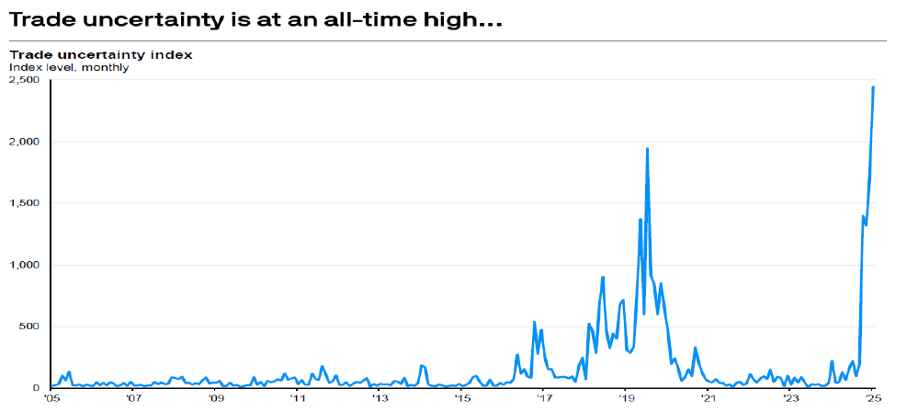
Of course, the tariff announcements on April 2 were much more global in nature and higher than expected. Stock markets around the world reacted negatively, as increased uncertainty weighed on investors. We saw an increase in President Trump’s first term and a spike in 2020 because of Covid. The recent spike has been intense as world leaders contemplate the road forward with the United States. The hope is that tensions and uncertainty will dissipate as reasonableness and cooler heads prevail. I am reminded of a long-ago warning from my dad as a youth. He said, “When you pick a fight with someone, you don’t get to pick how they respond…that is a pretty fair concern
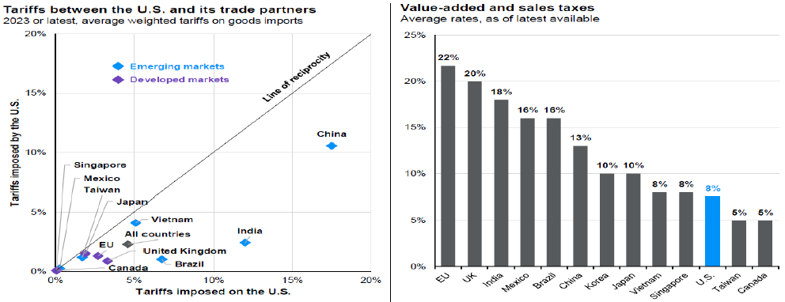
We have talked and written often recently about the need to have more reasonableness in our society in general. Our great nation was founded on that fundamental idea. We talk about it, as a foundational trait for our kids…be reasonable…in your relationships…in your investments…whatever. It works. It is our profound hope and belief that we must do so for the long-term good of our markets and economy. The final chart shows the imbalance in tariffs between the U.S. and other countries before the recent announcements. It is clear that there has been an imbalance. Every country in the graph falls below the line of reciprocity with the U.S., with India and China on the extremes. It is a reasonable exercise to try to bring those imbalances closer to neutral…”time may change me, but I can’t trace time."
In times of increased volatility, we look for opportunities…reasonable ones...