
Quarterly Review and Outlook:
December 2024
"Us Against the World"

LJohnson@fcbanking.com
412-208-7687
Connect on LinkedIn
A Look Back
The song, Us Against the World, by the band Coldplay was released in 2011 as part of the Mylo Xyloto album. The album debuted at #1 on the Billboard list, with first week sales of 447,000 copies. It has sold over 14,000,000 copies worldwide. Lead singer, Chris Martin, has said that the lyrics were more of a love song talking about how the couple could overcome anything the world could throw at them. From an investment perspective, the Us Against the World title reminded me of how dominant the United States financial markets have been on a global stage…really since the trough of the Great Recession in 2009. So, the Us can just be us like the title of the song, but can also be looked at as US…against the rest of the world, especially as we look at stock performance over the last 15 years or so.
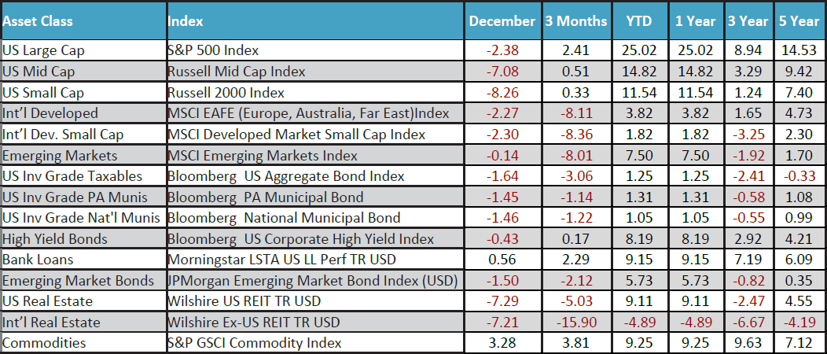
December was a tough month for most major asset classes, as stocks, bonds, and real estate all delivered negative returns. The Santa rally never really materialized as financial markets around the globe were digesting political and economic change. Even with the tough sledding in the month, US stocks substantially outperformed their international counterparts for the full year. In 2024, large-cap US stocks returned over 25%, while International Developed and Emerging Market stocks delivered 3.82% and 7.50%, respectively. It’s not necessarily surprising that US large-cap stocks have outperformed…the economy has been growing, and capital flows pretty freely here, but the magnitude of the outperformance and the consistency has been a bit of a deviation from historical norms. Looking at the five year annualized returns, the math gets more pronounced. If you had $1 million invested in each index: US large-cap, international developed and emerging markets, your ending values would be: $1,970,590, $1,259,956 and $1,087,940, respectively. That is a pretty big difference between asset classes that are supposed to be much closer in long-term performance.
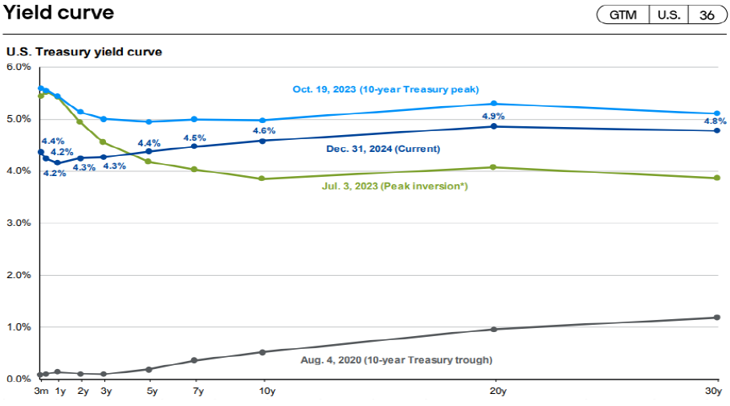
After a good first nine months, core bonds returned -3.06% in the last quarter, bringing the full-year performance down to just 1.25%. Even though the Fed started cutting the very short-term Fed Funds rate in September…and lowered it by a full percent by year-end, the longer part of the yield curve actually went the other way. For comparison, the 10 year US Treasury yield went from 3.65% on September 13th to 4.60% by year-end. That is nearly a full percent increase, while the Fed was purposefully decreasing the short-term Fed Funds rate. They do not exactly talk about that type of relationship in the financial textbooks! As we have written before: The Fed controls the short end of the yield curve, but the markets (supply and demand) control the longer part, and the last three months of 2024 definitively showed that.
It is worth a reminder to show just how much the yield curve in the US has changed, both recently and in the last five years. It really does impact so much of our everyday life (both good and bad) from how much interest we might earn in our savings accounts to the interest rates a financial institution charges customers for mortgages on their homes. The dark blue line in the graph below shows the current yield curve. A “normal” yield curve is one that is upward-sloping, where the longer time frame has higher yields associated with them…more time, more risk, more return…that makes some intuitive sense. However, things happen to disrupt that normal. Economic, societal, and government forces all can play a role at any given time. The Covid pandemic in early 2020 was an unforeseen event that forced governments around the globe to bring rates down across the board in an attempt to spur economic activity and investment…and it worked pretty well. Ultimately, the Fed has stated that they would like to see the Fed Funds rate reach a neutral level of around 3%. That is the rate that theoretically should neither make the economy grow or slow. We believe that we will get to that rate, but at a slower pace than has been anticipated. Much of the rally in stocks in the second half of 2024 was in anticipation of this move, and to the extent the move comes slower, it could act as a bit of a drag on returns
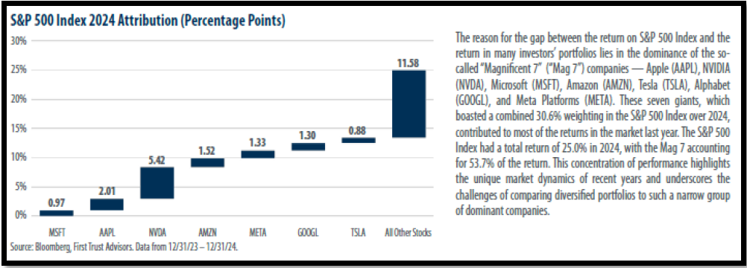
The chart below is an important one…and has been fairly persistent over the last couple of years. A handful of stocks known as the Magnificent Seven have really driven performance. Those seven stocks accounted for 13.5% of the 25%S&P total return in 2024, while the other 490 or so companies were responsible for the other 11.58%. Generally speaking, that is not the healthiest. of scenarios when so few stocks are driving overall performance. We would much rather see a more robust and wider participation…and so would stock pickers. With those seven stocks representing 54% of the overall performance in 2024, if you didn’t own them…or own them in the index weighting…it would be extremely difficult to just keep pace with the index itself.
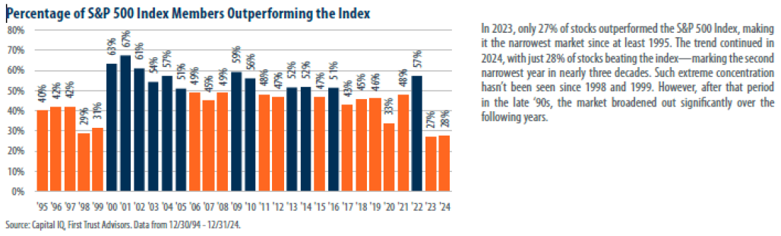
The chart below tells the story even better. The percentage of index members that outperform the index normally hovers around 50%, but was at 27% and 28% in 2023 and 2024. The last time we saw that type of concentration was in 1998 and 1999…or before the dot.com bubble…and then it did broaden out significantly over the next several years
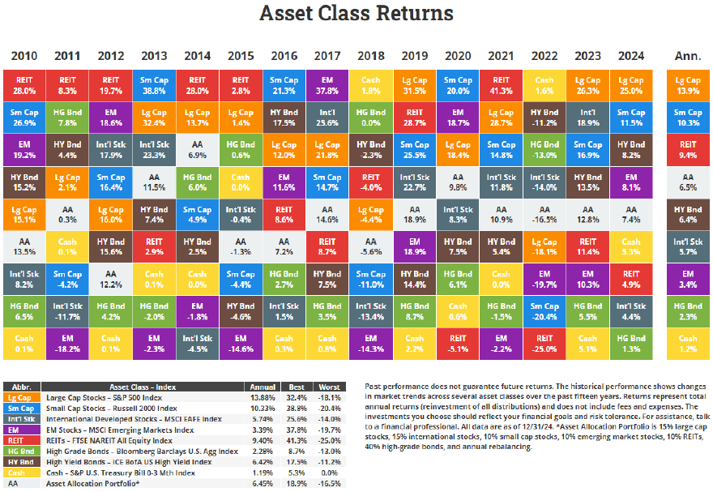
The following table is a little different look at asset class returns. The white AA box represents an Asset Allocation portfolio with the percent return breakdown listed. Over the last 15 years, large-cap US stocks have been the place to be, returning almost 14% a year, around 4% a year more than the 100-year average. Further, High-Grade Bonds show an annualized return of just 2.3%, or around 3% less than their long-term average.
A Look Forward
In general, the overall economic climate in the States remain fairly healthy. The most recent Jobs number surprised to the positive, as employers added 256,00 jobs in December versus expectations of 165,000. In addition, the unemployment rate fell to 4.1% from 4.2%. Of all of the economic indicators, this one is subject to revisions and swifter change, but the current numbers are good. Recent projections have the overall economy growing at 2.7-2.8% over next couple of years…not mind-blowing, but not a recipe for trouble and/or recession. Consumers are still spending. That is certainly necessary for a growing economy, but the level of credit card debt remains elevated. The most recent data shows credit debt at $1.17 trillion, up from the pandemic high of $927 billion. TransUnion reports that the average credit card balance in the US sits at$6,380, and the average interest rate on accounts with balances is 23.37%. Yikes!.
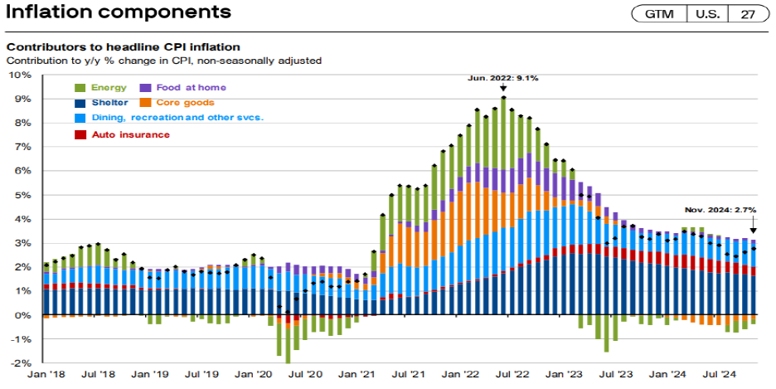
It’s also worth noting that, although inflation has certainly moderated over the last couple of years from the June 2022 high, it remains somewhat sticky. It is also interesting to see how the component drivers have changed. Energy was a huge source in 2022 and not so much today, while shelter and dining, and other recreational services remain high. Insurance costs have really become an issue…I see it at home, as auto and real estate costs have more than doubled over the last couple of years. We’ve seen progress to be sure, but those increased costs have already happened and continue to put pressure of the consumer
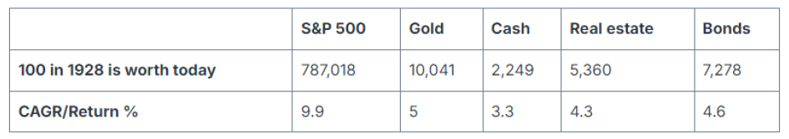
We end with the simplest of charts, but it gets at the heart of what we often talk about. There are important benefits to thinking like, and actually being a long-term investor. Every individual situation is different and bears the attention it deserves, but the numbers don’t lie. The chart shows what $100 invested at the beginning of 1928 would be worth at the end of 2023. The difference is striking. If you could have scraped together a $100 investment in the S&P 500 in 1928…and left it alone…it would have been worth $787,018! The next closest asset class is gold at $10,041. The difference really is a result of the difference in the CAGR (compound annual growth rate). In the first few years, the difference is negligible, but as you keep building in 10% on top of 10%, it increases exponentially. This is not to say that we all should just pile every dollar into the S&P 500. However, it should be a healthy component of any long-term allocation. Most importantly, it is a reminder that every percentage point…or even a fraction of a percentage point matters over time. In our business, and financial services in general, we can get lost in percentage comparisons sometimes. It’s important to peel that back and look at the actual dollar impact for clients.…
We realize that there is much going on in the United States and the world around us. There continues to be geopolitical concerns with the conflicts in Russia/Ukraine and the Middle East. There has been political change, not just here, but around the globe, as France, Germany and others grapple with changing societal and economic landscapes. With that, we remain cautiously optimistic about our own economy, while recognizing some of the issues discussed. 2024 was a great year for US stocks, which was on the back of a great year in 2023. Is it likely that we will see some increased volatility in 2025? Probably. And that shouldn’t be feared. It is part of the process and the cycle. We currently remain overweight to US stocks, with an underweight to International equities. We have also added a hedged equity allocation to our holdings that should help buffer returns, as well as decrease overall volatility. In addition, we have reduced our overall duration on the bond side, as we take the Fed at their word and believe that additional rate cuts will be harder to come by. Of course, this can all change pretty quickly, but we believe the US is still the best game in town…it’s us and US against the world!